5 Reasons Your Website Is So Slow (And How to Fix Each One)
Performance is not a luxury — it's a conversion, SEO, and retention problem
Iago Mussel
CEO & Founder
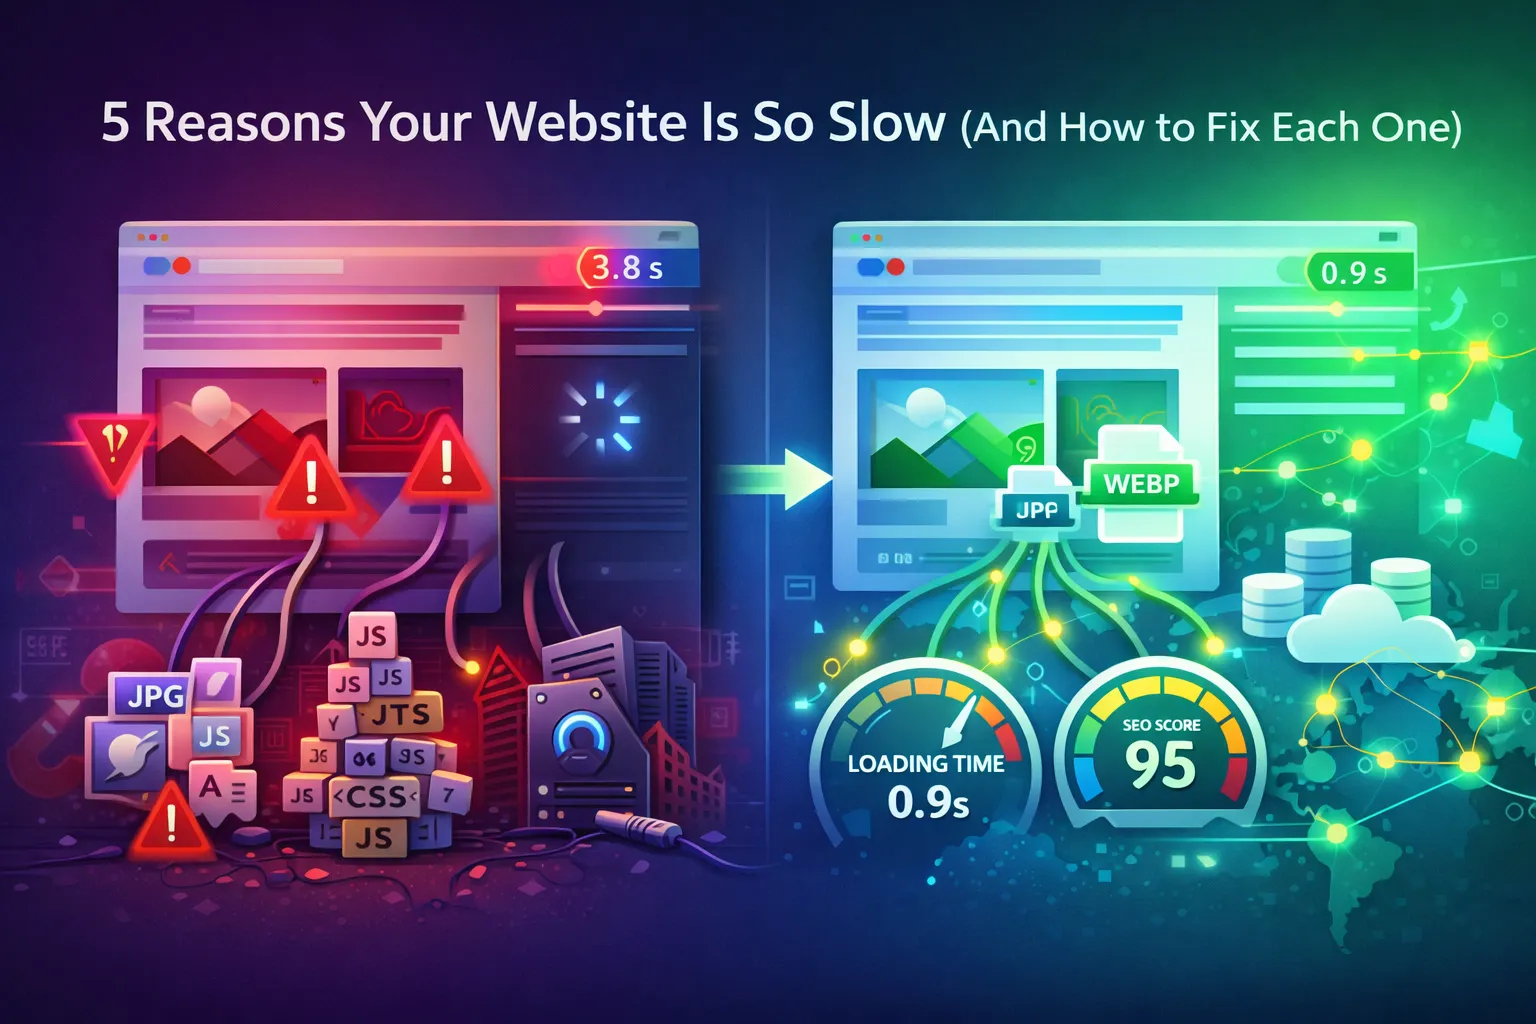
Table of Contents
- Why Page Speed Still Matters in 2026
- 1. Unoptimized Images
- 2. Render-Blocking JavaScript
- 3. No Caching Strategy
- 4. Slow Server Response (TTFB)
- 5. Too Many Third-Party Scripts
- Where to Start
Why Page Speed Still Matters in 2026
A one-second delay in page load time reduces conversions by approximately 7%. A three-second delay causes more than half of mobile users to abandon the page entirely. These numbers have been consistent across industry studies for over a decade, and they have not improved just because devices got faster — user expectations scaled with hardware.
Google confirmed page speed as a ranking signal with the 2021 Page Experience update. Core Web Vitals — LCP, CLS, and INP — are now direct inputs to search ranking. A slow site does not just frustrate users; it actively loses organic traffic to faster competitors in the same search results.
If your site scores below 70 on Lighthouse or PageSpeed Insights, the problems almost always trace back to one or more of these five root causes.
1. Unoptimized Images
Images are the single largest contributor to page weight on most websites. A typical marketing page contains 60–80% of its total payload in images. When those images are uncompressed PNGs, oversized JPEGs, or original exports from design tools, they can easily represent 5–10 MB of data that the browser has to fetch before it can finish rendering.
Why this kills performance: LCP — the time until the largest visible element renders — is directly tied to how long the hero image takes to load. A 3 MB hero image on a 20 Mbps connection still takes 1.2 seconds of transfer time alone, before decode and render.
The fix:
- Convert images to WebP. It delivers 25–90% smaller files compared to JPEG and PNG at equivalent visual quality.
- Serve appropriately sized images. A 3840px image displayed at 800px wide wastes bandwidth on every device that views it.
- Use
srcsetto serve different sizes to different viewports. - Apply
loading="lazy"to images below the fold so they do not block initial render.
<picture>
  <source srcset="hero.webp" type="image/webp" />
  <img
    src="hero.jpg"
    alt="Hero image"
    width="1280"
    height="720"
    loading="eager"
    fetchpriority="high"
  />
</picture>
The fetchpriority="high" attribute on your LCP image tells the browser to prioritize its download over other resources — a simple one-line improvement that measurably improves LCP scores.
For a fast, in-browser way to convert and compress your images without uploading them to any server, use HunterMussel Image Optimizer.
2. Render-Blocking JavaScript
When the browser encounters a <script> tag without async or defer, it stops parsing HTML, downloads the script, executes it, then continues. One large synchronous script in the <head> can hold up the entire page render for hundreds of milliseconds.
Common sources of render-blocking JS:
- Analytics libraries loaded synchronously
- Tag manager containers with blocking tags
- UI component libraries fully loaded up front
- Legacy jQuery plugins
The fix:
Add defer to scripts that do not need to run before the DOM is parsed. Use async for scripts with no dependencies. Move non-critical scripts to the bottom of <body> if they are legacy and cannot take attributes.
<!-- Blocks rendering — avoid -->
<script src="analytics.js"></script>

<!-- Non-blocking — preferred -->
<script src="analytics.js" defer></script>
For modern JavaScript bundlers, enable code splitting so that only the code needed for the current route is loaded. React, Vue, and Svelte all support dynamic imports:
// Load heavy component only when needed
const HeavyChart = lazy(() => import('./HeavyChart'));
A bundle that was 800 KB before code splitting typically becomes a 120 KB initial load with the rest deferred. That is a direct improvement on Time to Interactive.
3. No Caching Strategy
Every time a user visits your site without caching configured, their browser re-downloads every asset — CSS, JS, fonts, images — regardless of whether those files changed since their last visit. For a returning user, this means full page weight on every visit.
The fix:
Set aggressive Cache-Control headers on static assets with content hashes in their filenames. The hash changes when the file changes, so browsers know when to re-fetch.
# Long cache on hashed assets (CSS, JS, images)
Cache-Control: public, max-age=31536000, immutable

# Short cache on HTML (changes frequently)
Cache-Control: public, max-age=300
Most CDNs (Cloudflare, Vercel, Netlify) apply sensible defaults, but they are often conservative. Review your response headers with DevTools → Network → Headers and look for Cache-Control values like no-cache or max-age=0 on assets that rarely change.
For service workers (PWAs), implement a cache-first strategy for static assets:
self.addEventListener('fetch', (event) => {
  event.respondWith(
    caches.match(event.request).then((cached) => cached || fetch(event.request))
  );
});
Returning users should see nearly instant loads for unchanged assets. If they do not, caching is broken somewhere in the chain.
4. Slow Server Response (TTFB)
Time to First Byte (TTFB) measures how long it takes for the server to respond after the browser sends a request. High TTFB delays everything downstream — the browser cannot start parsing HTML until that first byte arrives.
Common causes:
- No CDN — server is geographically far from the user
- Unoptimized database queries — pages that require 10+ database calls before rendering
- No output caching — server regenerates every page from scratch on every request
- Shared hosting — CPU and memory contention from neighboring tenants
The fix:
Put a CDN in front of your origin. Cloudflare’s free tier moves static assets and cached pages to edge nodes close to each user. A user in São Paulo hitting a server in Frankfurt sees 200ms+ of base latency before any data transfers — a CDN in São Paulo eliminates that.
For dynamic pages, implement output caching at the framework or infrastructure level:
// Next.js — cache a page at the edge for 60 seconds
export const revalidate = 60;
Target TTFB under 800ms for a “good” rating. Below 200ms puts you in the top tier. If you are above 800ms and your server is under-loaded, the problem is almost always lack of caching or geographic distance — both solved by a CDN.
5. Too Many Third-Party Scripts
The average commercial website loads 15–20 third-party scripts: analytics, chat widgets, A/B testing platforms, cookie consent banners, social share buttons, retargeting pixels, heatmap tools. Each of these:
- Adds a DNS lookup
- Adds a TCP connection
- Downloads JS that executes on the main thread
- Can block or delay your own first-party code
The compounding effect is significant. A page with 10 third-party scripts can easily have 300–500ms of main thread blocking from third-party code alone — time during which the browser cannot respond to user input or continue rendering.
The fix:
Audit your third-party scripts with Lighthouse or WebPageTest’s “Third-Party Summary.” Identify scripts by their impact (main thread time, transfer size) and question whether each one is essential.
Common wins:
- Replace full analytics libraries with lightweight alternatives. Plausible and Fathom load in under 1 KB. Google Analytics 4 loads ~45 KB.
- Delay non-critical scripts until after the page has loaded interactively:
window.addEventListener('load', () => {
  const script = document.createElement('script');
  script.src = 'https://third-party-widget.com/embed.js';
  document.body.appendChild(script);
});- Use a tag manager that supports load order configuration so marketing scripts fire after the page is interactive, not before.
- For chat widgets and similar heavy embeds, only load them when the user signals intent (hover, scroll to bottom, click a trigger button).
The goal is not to eliminate third-party scripts entirely — analytics and chat tools have real business value. The goal is to ensure they load after your own content is interactive and visible.
Where to Start
If you are running your site through PageSpeed Insights or Lighthouse for the first time, the results can be overwhelming. Prioritize fixes in this order:
- Images first — highest impact, lowest risk, no code changes required
- Remove or defer render-blocking scripts — medium effort, high impact on LCP and FCP
- Add a CDN — fixes TTFB and geographic latency with minimal configuration
- Audit third-party scripts — remove what you do not measure; delay what you do not need immediately
- Configure cache headers — permanent win for returning visitors; requires server or CDN configuration
Each fix compounds. A site that addresses all five typically moves from a 40–50 Lighthouse score to above 90 — and the business impact follows: lower bounce rates, better rankings, and measurably higher conversion on pages that previously loaded slowly.
Start with your images. It is the fastest fix with the highest return.